

RTN-109
DRP Resource Usage Estimates#
Abstract
Using job profiling and dataset size information from intermittent DRP runs at USDF, task dependencies inferred from LSSTCam DRP pipeline definitions, and observing sequences from consdb or from a opsim simulation, the computing resource usage (disk space and CPU time) are estimated for DP2 and DR1 processings.
Methodology#
The “intermittent” DRP runs are performed at USDF approximately bi-weekly. These runs are used to exercise new development in the Rubin science pipelines in order to uncover potential issues with running the pipelines at scale. In addition to testing the algorithmic and middleware changes, these runs are also useful for tracking pipeline performance. For the DRP resource usage estimates, we track the per-job memory usage, cpu run times, and wall times as extracted from the metadata that are generated for every instance of the various pipeline tasks.
For producing resource usage estimates for a potential DRP processing campaign, it is sufficient for most tasks to use typical values for the cpu time and memory requirements since they are not strongly dependent on their inputs. However, the resource usage for a number of tasks does depend strongly on the input data. In particular, several tasks that process coadd-related data products depend strongly on the number of visits that the coadd comprises. Similarly, tasks that measure per-source properties on images will have resource needs that scale as the local object density on the sky. For determining the cpu time and memory scaling with number of visits per coadd, we extract the expected numbers of input visits from the QuantumGraph. The local stellar density is the most relevant quantity for source measurement scaling, however, at this time we don’t account for that dependence.
The observation sequence for a potential DRP campaign can be obtained either from real observations by querying consdb or from simulated observing cadences contained in an opsim db file. The key features of a pointing that determine the structure of the QG are the individual CCD overlaps with the skymap patches. Thos overlaps determine the number of warps per patch and hence the visit depth for a given coadd. In order to calculate those overlaps, for consdb observations, we use the per CCD s_region info, which describes CCD area projected on the sky, from consdb, while for opsim db observations, we use the approximate wcs obtained with the lsst.obs.base.createInitialSkyWcsFromBoresight function to obtain the equivalent CCD sky projection. Since we’re doing an approximate calculation anyway, we simply use the skymap.findTractPatchList function to obtain the CCD-patch overlaps.
We determine the pipeline tasks, their dependencies, and the dataset types from the pipeline yaml, e.g., drp_pipe/LSSTCam/DRP.yaml for the full pipeline. We then infer the number of instances of each task and their associated dataIds from the task dimensions in the pipeline definition and the overlap information.
The overall CPU time resource estimates are the predicted CPU run times weighted by the expected number of cores required to do the processing. This number is inferred from the predicted memory usage, assuming a fixed amount of memory per core. For running at USDF, we nominally have 4 GB per core, so a job that requires 1 CPU minute and 5 GB of memory would have weighted CPU time of 2 CPU minutes.
For disk storage estimates, we sample the dataset sizes for a recent run to obtain an average dataset size. To obtain the predicted storage for each dataset type, we multiply the number of corresponding task instances by those measured average dataset sizes.
Modeling CPU Times and Memory Usage#
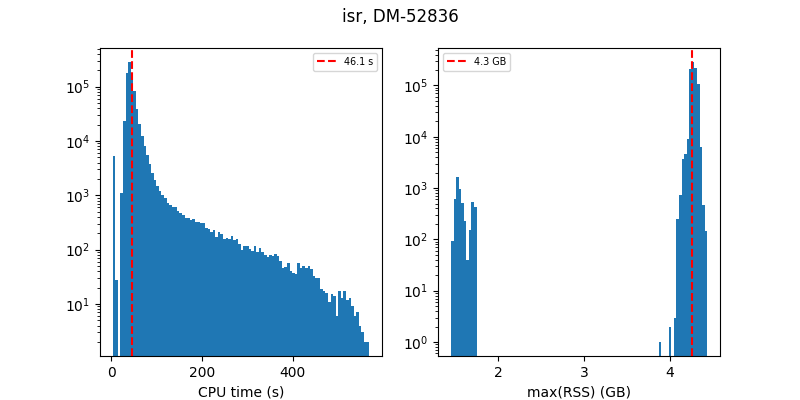
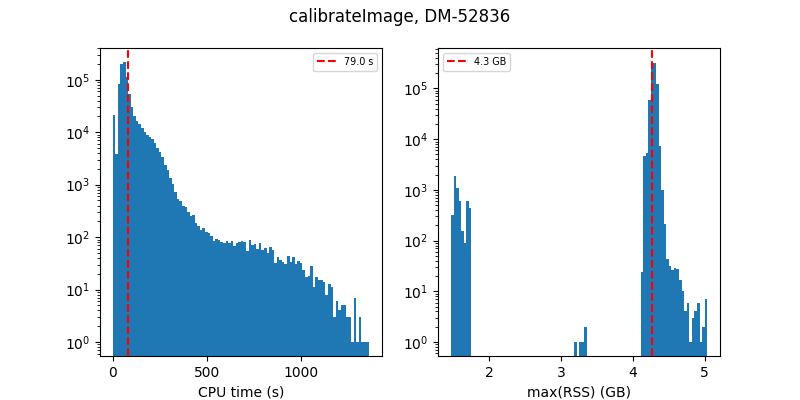
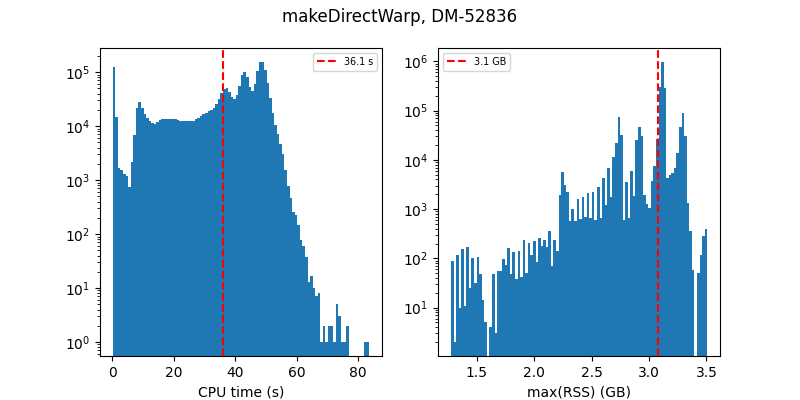
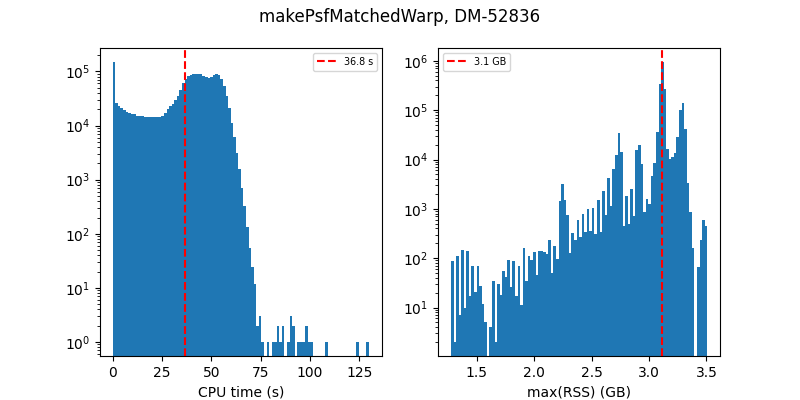
For tasks that do not have significant scaling dependence, we simply use the mean values for the per-job CPU times and memory usage. Figure 1 below shows those distributions for the isr, calibrateImage, makeDirectWarp, and makePsfMatchedWarp from the DM-52836/w_2025_41 DRP processing, with the mean values used in the CPU and memory calculations indicated.
Figure 1: CPU time and memory usage for isr, calibrateImage, makeDirectWarp, and makePsfMatchedWarp tasks in DM-52836. The red dashed lines indicate the mean values that are used in the projected estimates.
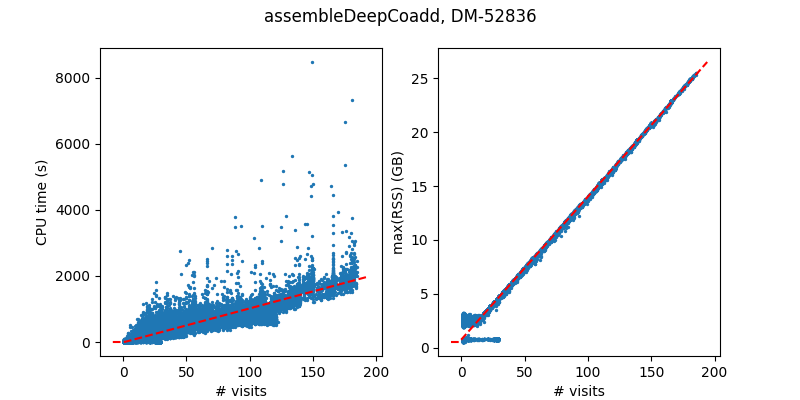
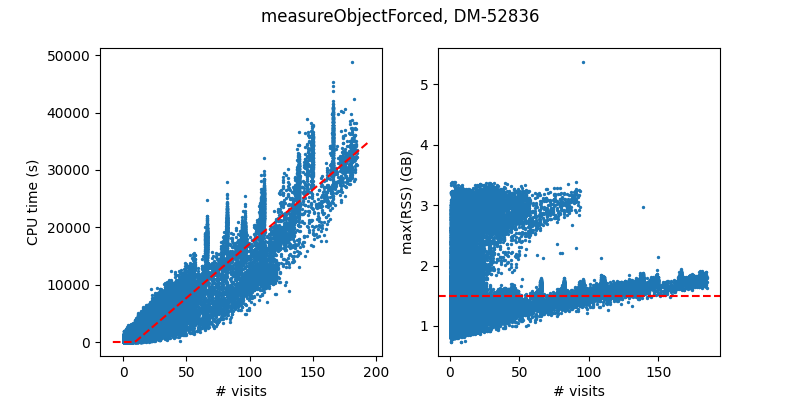
As noted, the resource usage for some tasks in the coadd and variability-related processing stages have strong dependence on the number of visits. In order to model that dependence, we partition the data in bins of numbers of visits, then fit a line to the median values in those bins. Some of these tasks have strong dependence on numbers of visits for both CPU time and memory, and some just have a strong dependence on just one or the other. In Figure 2, we show the fitted lines for assembleDeepCoadd, where the visit-dependence is modeled for both CPU time and memory usage, and for measureObjectForced where just the CPU time shows a strong dependence on the numbers of visits, whereas for the memory we use a constant value, in this case, the mean value of 1.5 GB.
Figure 2: CPU time and memory usage for assembleDeepCoadd and measureObjectForced for DM-52836.
Comparison of Projected and Actual Resource Usage#
Here we use a recent intermittent DRP to compare our predicted resource estimates with the actual values. As inputs to our calculation, we use the metadata and mean storage sizes for the actual DRP run being considered, DM-52836.
In Table 1, we compare the predicted number of jobs from our overlaps-based calcuation with the numbers computed in the QuantumGraph generation step for a representative subset of tasks. For tasks including and downstream of makeDirectWarp, our overlaps-based calculation over-predicts the numbers of jobs at the ~24% level.
Table 1: Number of jobs for selected tasks for DM-52836
task |
predicted |
actual |
|---|---|---|
isr |
868438 |
854501 |
consolidateVisitSummary |
4798 |
4721 |
associateIsolatedStar |
383 |
393 |
makeDirectWarp |
2593360 |
2115198 |
assembleDeepCoadd |
153261 |
123369 |
makeHealSparsePropertyMaps |
2019 |
1634 |
mergeObjectDetection |
29184 |
26788 |
forcedPhotObjectDetector |
1477196 |
1185206 |
In Table 2, we compare the predicted CPU time estimates per task (summed over all jobs) with the actual CPU times from the task metadata files. These are ordered by total CPU time, comprising the top 95% of tasks.
Table 2: Predicted and actual CPU times for the tasks in DM-52836.
task |
predicted (s) |
actual (s) |
ratio |
cumulative fraction |
|---|---|---|---|---|
measureObjectForced |
2.9e+08 |
3.3e+08 |
1.12 |
0.21 |
measureObjectUnforced |
1.2e+08 |
2.0e+08 |
1.62 |
0.34 |
calibrateImage |
1.4e+08 |
1.4e+08 |
0.98 |
0.43 |
forcedPhotObjectDetector |
1.2e+08 |
9.8e+07 |
0.80 |
0.49 |
isr |
8.0e+07 |
7.9e+07 |
0.98 |
0.54 |
makePsfMatchedWarp |
9.6e+07 |
7.8e+07 |
0.82 |
0.59 |
makeDirectWarp |
9.4e+07 |
7.6e+07 |
0.82 |
0.64 |
reprocessVisitImage |
7.3e+07 |
6.3e+07 |
0.87 |
0.68 |
fitDeepCoaddPsfGaussians |
4.8e+07 |
6.1e+07 |
1.26 |
0.72 |
assembleDeepCoadd |
6.8e+07 |
5.3e+07 |
0.77 |
0.75 |
refitPsfModelDetector |
3.2e+07 |
4.4e+07 |
1.36 |
0.78 |
subtractImages |
5.5e+07 |
4.3e+07 |
0.78 |
0.81 |
assembleCellCoadd |
4.0e+07 |
3.6e+07 |
0.90 |
0.83 |
detectAndMeasureDiaSource |
4.3e+07 |
3.4e+07 |
0.78 |
0.85 |
rewarpTemplate |
3.8e+07 |
3.0e+07 |
0.79 |
0.87 |
deblendCoaddFootprints |
3.1e+07 |
2.6e+07 |
0.85 |
0.89 |
deconvolve |
3.4e+07 |
2.6e+07 |
0.77 |
0.91 |
fitDeblendedObjectsExp |
2.2e+07 |
2.4e+07 |
1.10 |
0.92 |
forcedPhotDiaObjectDetector |
2.5e+07 |
2.0e+07 |
0.80 |
0.94 |
fitDeblendedObjectsSersic |
1.7e+07 |
1.8e+07 |
1.11 |
0.95 |
Wall Time Considerations#
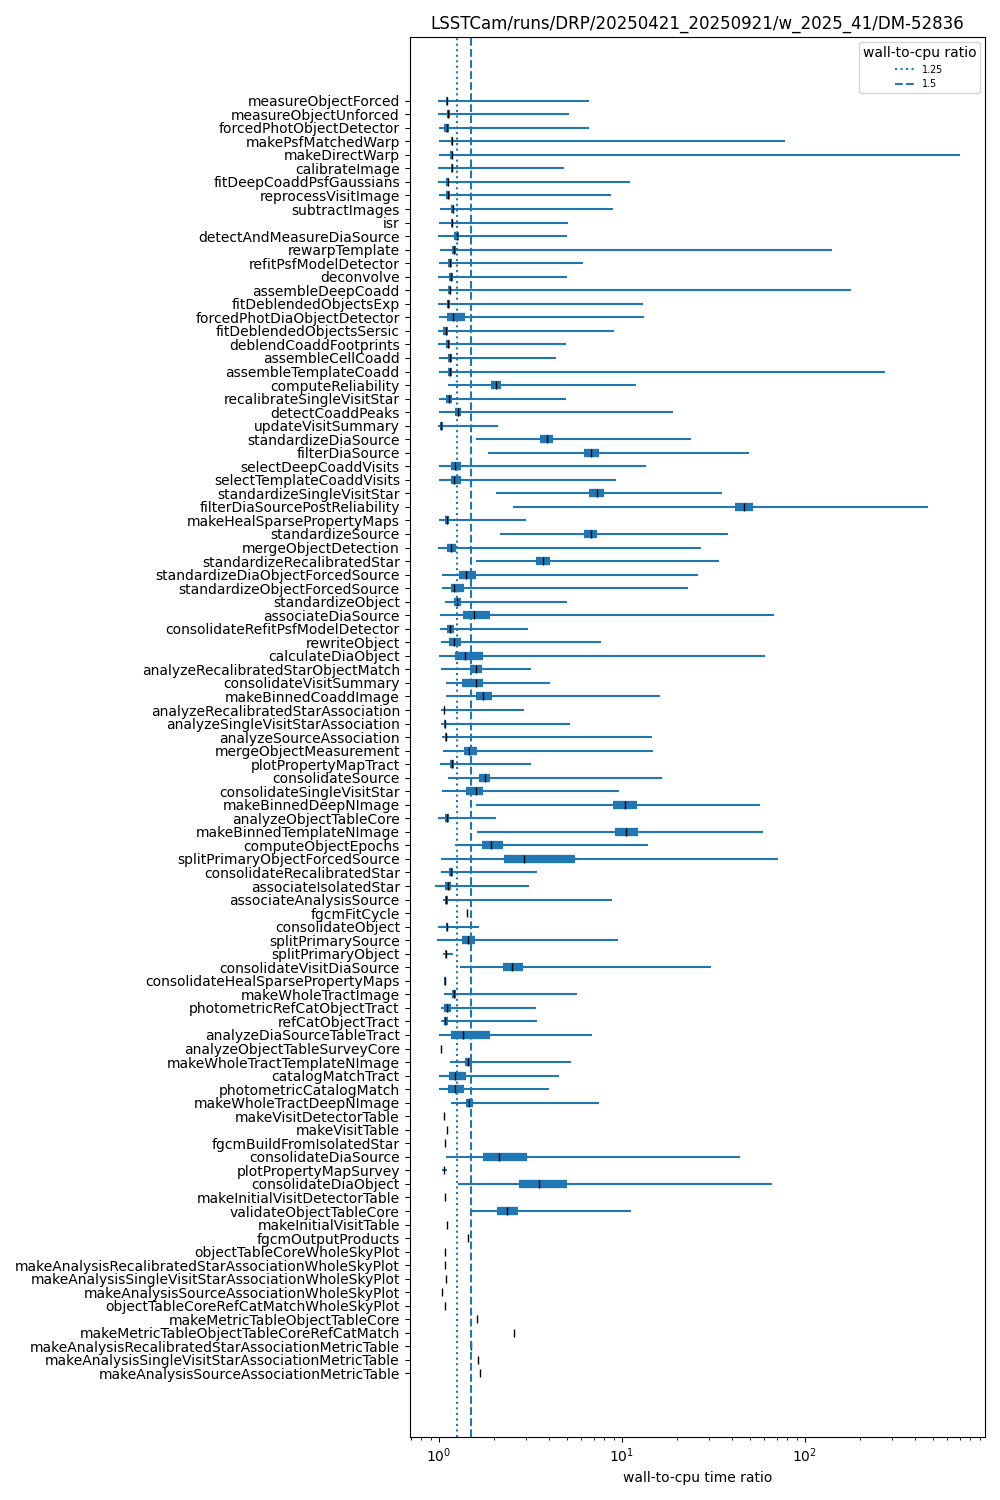
The measured wall times for some jobs can be substantially larger than the CPU times, e.g., for jobs that are affected by slow I/O. Since we have used job CPU times instead of wall times, it’s useful to have comparisons of the typical wall and cpu times for the each task. In Figure 3, we show box plots of the distributions of wall-to-cpu time ratios for each task, sorted by integrated wall time for DM-52836. For each task, we plot the 0, 32, 50, 68, and 100 percentile values.
Figure 3: Box plot of wall-to-CPU time ratios for tasks in DM-52836.
Predictions for DP2#
These estimates use the DRP.yaml pipeline definition in w_2025_41, and are based on resource usage data from DM-52836. The input observations are a selection of science observations using LSSTCam, extracted from the consolidated database (consdb). The query used for the selection is shown below. For computing the number of datasets per dataset type and information such as the number of visits per patch per band, the lsst_cells_v1 skymap was used.
Storage by Dataset Type#
There are over 400 dataset types (dstype) in the w_2025_41 LSSTCam DRP pipeline. In Table 3, the entries have been sorted total size for each dstype. The top 20 entries are shown, which add up to ~96% of the 5.7 PB total.
Table 3: Predicted storage requirements for DP2 for the largest dataset types.
dstype |
count |
total size (GB) |
cumulative size (PB) |
cumulative fraction |
|---|---|---|---|---|
direct_warp |
11571944 |
933659 |
0.93 |
0.16 |
psf_matched_warp |
11571944 |
644267 |
1.58 |
0.28 |
template_detector |
3823388 |
557988 |
2.14 |
0.37 |
deep_coadd_cell_predetection |
1072709 |
433515 |
2.57 |
0.45 |
difference_image_predetection |
3823388 |
411827 |
2.98 |
0.52 |
template_matched |
3823388 |
411397 |
3.39 |
0.59 |
visit_image |
3823388 |
410626 |
3.80 |
0.66 |
preliminary_visit_image |
3823388 |
409993 |
4.21 |
0.74 |
difference_image |
3823388 |
409839 |
4.62 |
0.81 |
post_isr_image |
3823388 |
354549 |
4.98 |
0.87 |
deep_coadd |
1072709 |
85341 |
5.06 |
0.88 |
deep_coadd_predetection |
1072709 |
82923 |
5.15 |
0.90 |
template_coadd |
1072709 |
81535 |
5.23 |
0.91 |
object_unstandardized |
293894 |
62583 |
5.29 |
0.92 |
source_footprints |
3823388 |
53234 |
5.34 |
0.93 |
deconvolved_deep_coadd |
1072709 |
48414 |
5.39 |
0.94 |
single_visit_star_footprints |
3823388 |
41864 |
5.43 |
0.95 |
object_unforced_measurement |
1072709 |
32032 |
5.47 |
0.95 |
object_forced_measurement |
1072709 |
31222 |
5.50 |
0.96 |
object_forced_source_unstandardized |
6507208 |
25245 |
5.52 |
0.96 |
Limiting to the dataset types that are identified as “release” products in a recent storage model discussion, the remaining data volume is ~610 TB:
Table 4: Predicted storage requirements for DP2 release products
dstype |
count |
total size (GB) |
cumulative size (PB) |
cumulative fraction |
|---|---|---|---|---|
visit_image |
3823388 |
410626 |
0.41 |
0.68 |
deep_coadd |
1072709 |
85341 |
0.50 |
0.82 |
template_coadd |
1072709 |
81535 |
0.58 |
0.95 |
object_scarlet_models |
293894 |
6836 |
0.58 |
0.96 |
object_nonprimary |
3650 |
5035 |
0.59 |
0.97 |
object |
3650 |
4477 |
0.59 |
0.98 |
source2 |
22229 |
4363 |
0.60 |
0.99 |
object_forced_source_nonprimary |
293894 |
2727 |
0.60 |
0.99 |
object_forced_source |
293894 |
2049 |
0.60 |
0.99 |
compare_warp_artifact_mask |
1072709 |
854 |
0.60 |
0.99 |
source_nonprimary |
22229 |
839 |
0.60 |
1.00 |
dia_object_forced_source |
293894 |
598 |
0.61 |
1.00 |
deep_coadd_n_image |
1072709 |
543 |
0.61 |
1.00 |
visit_summary |
22229 |
467 |
0.61 |
1.00 |
visit_image_background |
3823388 |
440 |
0.61 |
1.00 |
isolated_star |
3650 |
247 |
0.61 |
1.00 |
dia_source |
3650 |
215 |
0.61 |
1.00 |
deep_coadd_background |
1072709 |
52 |
0.61 |
1.00 |
dia_object |
3650 |
29 |
0.61 |
1.00 |
CPU Times by Task#
Bbased on the DRP performance in DM-52836, here are the CPU time requirements for each task. The cpu times (in seconds) are weighted by the number of cores implied by the memory needs for each job. In the final column, the “cumulative node days” has been computed assuming 120 cores per node. The ordering of the rows is the nominal execution order of the tasks inferred from the LSSTCam DRP pipeline yaml.
The total cpu time is ~780 node days, so assuming we run at full capacity on 110 nodes at USDF, this implies a minimum end-to-end wall time of 7 days.
Table 5: Predicted CPU times for each task in a DP2 processing
task |
# jobs |
CPU time (s) |
cumulative node days |
|---|---|---|---|
isr |
3823388 |
3.52e+08 |
33.99 |
calibrateImage |
3823388 |
6.04e+08 |
92.27 |
standardizeSingleVisitStar |
3823388 |
2.54e+06 |
92.51 |
consolidateVisitSummary |
22229 |
7.81e+05 |
92.59 |
consolidateSingleVisitStar |
22229 |
3.15e+05 |
92.62 |
makeInitialVisitDetectorTable |
1 |
7.31e+02 |
92.62 |
makeInitialVisitTable |
1 |
5.00e+02 |
92.62 |
associateIsolatedStar |
3650 |
9.34e+05 |
92.71 |
analyzeSingleVisitStarAssociation |
3650 |
7.86e+06 |
93.47 |
makeAnalysisSingleVisitStarAssoc… |
1 |
2.67e+00 |
93.47 |
makeAnalysisSingleVisitStarAssoc… |
1 |
4.96e+01 |
93.47 |
fgcmBuildFromIsolatedStar |
1 |
3.68e+04 |
93.47 |
gbdesHealpix3AstrometricFit |
12590 |
1.11e+09 |
200.52 |
refitPsfModelDetector |
3823388 |
1.42e+08 |
214.20 |
fgcmFitCycle |
1 |
8.70e+05 |
214.28 |
consolidateRefitPsfModelDetector |
22229 |
1.79e+06 |
214.46 |
fgcmOutputProducts |
1 |
6.20e+02 |
214.46 |
updateVisitSummary |
22229 |
2.21e+07 |
216.59 |
recalibrateSingleVisitStar |
3823388 |
3.23e+07 |
219.70 |
makeVisitDetectorTable |
1 |
3.82e+03 |
219.70 |
makeVisitTable |
1 |
3.34e+03 |
219.70 |
standardizeRecalibratedStar |
3823388 |
1.05e+06 |
219.81 |
consolidateRecalibratedStar |
22229 |
2.66e+05 |
219.83 |
analyzeRecalibratedStarAssociation |
3650 |
6.56e+06 |
220.46 |
makeAnalysisRecalibratedStarAsso… |
1 |
3.28e+00 |
220.46 |
makeAnalysisRecalibratedStarAsso… |
1 |
5.52e+01 |
220.46 |
makeDirectWarp |
11571944 |
4.17e+08 |
260.71 |
selectDeepCoaddVisits |
1072709 |
1.67e+07 |
262.32 |
selectTemplateCoaddVisits |
1072709 |
1.66e+07 |
263.92 |
makePsfMatchedWarp |
11571944 |
4.26e+08 |
305.05 |
assembleDeepCoadd |
1072709 |
3.10e+08 |
334.94 |
assembleTemplateCoadd |
1072709 |
1.61e+08 |
350.50 |
makeBinnedDeepNImage |
1072709 |
6.61e+04 |
350.50 |
assembleCellCoadd |
1072709 |
1.77e+08 |
367.57 |
makeHealSparsePropertyMaps |
12590 |
1.36e+07 |
368.89 |
detectCoaddPeaks |
1072709 |
8.95e+07 |
377.51 |
makeBinnedTemplateNImage |
1072709 |
6.40e+04 |
377.52 |
makeWholeTractDeepNImage |
12590 |
2.04e+04 |
377.52 |
plotPropertyMapTract |
12590 |
2.04e+06 |
377.72 |
consolidateHealSparsePropertyMaps |
7 |
2.10e+04 |
377.72 |
makeBinnedCoaddImage |
1072709 |
1.01e+06 |
377.82 |
mergeObjectDetection |
293894 |
7.57e+06 |
378.55 |
makeWholeTractTemplateNImage |
12590 |
2.41e+04 |
378.55 |
plotPropertyMapSurvey |
7 |
8.59e+03 |
378.55 |
makeWholeTractImage |
12590 |
6.28e+04 |
378.56 |
deconvolve |
1072709 |
2.40e+08 |
401.68 |
deblendCoaddFootprints |
293894 |
3.12e+08 |
431.79 |
measureObjectUnforced |
1072709 |
4.05e+08 |
470.87 |
fitDeepCoaddPsfGaussians |
1072709 |
1.61e+08 |
486.42 |
mergeObjectMeasurement |
293894 |
1.24e+06 |
486.54 |
fitDeblendedObjectsExp |
293894 |
2.20e+08 |
507.73 |
measureObjectForced |
1072709 |
1.00e+09 |
604.40 |
fitDeblendedObjectsSersic |
293894 |
1.68e+08 |
620.56 |
rewriteObject |
293894 |
3.32e+06 |
620.88 |
computeObjectEpochs |
293894 |
4.22e+05 |
620.92 |
standardizeObject |
293894 |
5.00e+06 |
621.40 |
consolidateObject |
3650 |
8.36e+05 |
621.48 |
analyzeObjectTableCore |
3650 |
7.47e+05 |
621.56 |
analyzeObjectTableSurveyCore |
1 |
7.34e+04 |
621.56 |
catalogMatchTract |
3650 |
4.03e+04 |
621.57 |
photometricCatalogMatch |
3650 |
4.08e+04 |
621.57 |
validateObjectTableCore |
3650 |
2.32e+03 |
621.57 |
splitPrimaryObject |
3650 |
1.10e+06 |
621.68 |
makeMetricTableObjectTableCore |
1 |
3.53e+00 |
621.68 |
refCatObjectTract |
3650 |
5.90e+04 |
621.68 |
photometricRefCatObjectTract |
3650 |
5.72e+04 |
621.69 |
objectTableCoreWholeSkyPlot |
1 |
1.53e+02 |
621.69 |
makeMetricTableObjectTableCoreRe… |
1 |
2.10e+00 |
621.69 |
objectTableCoreRefCatMatchWholeS… |
1 |
2.29e+01 |
621.69 |
analyzeRecalibratedStarObjectMatch |
22229 |
1.01e+06 |
621.79 |
reprocessVisitImage |
3823388 |
3.21e+08 |
652.77 |
standardizeSource |
3823388 |
1.25e+06 |
652.89 |
rewarpTemplate |
3823388 |
1.66e+08 |
668.90 |
consolidateSource |
22229 |
3.53e+05 |
668.93 |
subtractImages |
3823388 |
2.42e+08 |
692.23 |
associateAnalysisSource |
3650 |
1.37e+06 |
692.36 |
splitPrimarySource |
22229 |
1.65e+05 |
692.38 |
detectAndMeasureDiaSource |
3823388 |
1.91e+08 |
710.78 |
analyzeSourceAssociation |
3650 |
7.50e+06 |
711.50 |
filterDiaSource |
3823388 |
1.95e+06 |
711.69 |
forcedPhotObjectDetector |
6507208 |
5.36e+08 |
763.41 |
makeAnalysisSourceAssociationMet… |
1 |
2.53e+00 |
763.41 |
computeReliability |
3823388 |
1.78e+07 |
765.12 |
standardizeObjectForcedSource |
293894 |
1.53e+06 |
765.27 |
makeAnalysisSourceAssociationWho… |
1 |
4.88e+01 |
765.27 |
filterDiaSourcePostReliability |
3823388 |
2.51e+05 |
765.29 |
splitPrimaryObjectForcedSource |
293894 |
1.05e+05 |
765.30 |
standardizeDiaSource |
3823388 |
4.12e+06 |
765.70 |
consolidateVisitDiaSource |
22229 |
7.94e+04 |
765.71 |
associateDiaSource |
293894 |
4.11e+06 |
766.11 |
calculateDiaObject |
293894 |
2.56e+06 |
766.35 |
consolidateDiaSource |
3650 |
1.22e+04 |
766.35 |
consolidateSsTables |
1 |
6.00e+01 |
766.35 |
consolidateDiaObject |
3650 |
3.41e+03 |
766.35 |
forcedPhotDiaObjectDetector |
6507208 |
1.11e+08 |
777.11 |
analyzeDiaSourceTableTract |
3650 |
4.64e+04 |
777.11 |
standardizeDiaObjectForcedSource |
293894 |
2.09e+06 |
777.31 |
Data Selection#
In the absence of an “official” data selection, I made the following query to consdb on 2025-10-16 to obtain the input observations for these calculations:
select v.band, v.visit_id, v.exp_midpt_mjd, v.exp_time, v.sky_rotation,
   cv.detector, cv.s_region, v.s_ra, v.s_dec, v.science_program, v.target_name,
   v.img_type from cdb_lsstcam.ccdvisit1 as cv, cdb_lsstcam.visit1 as v
   where cv.visit_id=v.visit_id and v.img_type='science'
   and -50 < v.s_dec and v.s_dec < 24 and cv.detector < 189
   and cv.detector not in (0, 20, 27, 65, 123, 161, 168, 188, 122, 169,
   187, 120, 158, 30, 68, 1, 19)
This selection yielded 22229 visits.
Predictions for DR1#
The inputs used for these calculations are the Y1 observations from the baseline v5.0 simulations, specifically, from the baseline_v5.0.0_10yrs.db opsim db file. As with the DP2 estimates, the DRP.yaml pipeline definition in w_2025_43, the resource usage data from DM-52836 and the lsst_cells_v1 skymap were used.
Storage by Dataset Type#
Here are the top 20 entries by dataset type, which add up to ~96% of the 53 PB total:
Table 6: Predicted storage requirements for DR1 for the largest dataset types by task.
dstype |
count |
total size (GB) |
cumulative size (PB) |
cumulative fraction |
|---|---|---|---|---|
direct_warp |
107391908 |
8609545 |
8.61 |
0.16 |
psf_matched_warp |
107391908 |
5942269 |
14.55 |
0.28 |
template_detector |
37270840 |
5524005 |
20.08 |
0.38 |
difference_image_predetection |
37270840 |
4030122 |
24.11 |
0.46 |
visit_image |
37270840 |
4028123 |
28.13 |
0.53 |
difference_image |
37270840 |
4020820 |
32.15 |
0.61 |
template_matched |
37270840 |
4005466 |
36.16 |
0.68 |
preliminary_visit_image |
35596260 |
3846503 |
40.01 |
0.76 |
post_isr_image |
35596260 |
3353074 |
43.36 |
0.82 |
deep_coadd_cell_predetection |
7398852 |
2949643 |
46.31 |
0.88 |
source_footprints |
37270840 |
791025 |
47.10 |
0.89 |
deep_coadd |
7398852 |
602835 |
47.70 |
0.90 |
single_visit_star_footprints |
35596260 |
584998 |
48.29 |
0.91 |
deep_coadd_predetection |
7398852 |
580680 |
48.87 |
0.92 |
template_coadd |
7398852 |
554005 |
49.42 |
0.93 |
deconvolved_deep_coadd |
7398852 |
349634 |
49.77 |
0.94 |
source_unstandardized |
37270840 |
343831 |
50.12 |
0.95 |
object_unstandardized |
1285731 |
300757 |
50.42 |
0.95 |
object_forced_source_unstandardized |
61040677 |
279627 |
50.70 |
0.96 |
object_unforced_measurement |
7398852 |
233204 |
50.93 |
0.96 |
Here are the data volumes for the release dataset types, totaling 5.4 PB:
Table 7: Predicted storage requirements for DR1 release products
dstype |
count |
total size (GB) |
cumulative size (PB) |
cumulative fraction |
|---|---|---|---|---|
visit_image |
37270840 |
4028123 |
4.03 |
0.74 |
deep_coadd |
7398852 |
602835 |
4.63 |
0.86 |
template_coadd |
7398852 |
554005 |
5.18 |
0.96 |
source2 |
267902 |
71587 |
5.26 |
0.97 |
object_scarlet_models |
1285731 |
43853 |
5.30 |
0.98 |
object |
13015 |
17481 |
5.32 |
0.98 |
object_nonprimary |
13015 |
16142 |
5.33 |
0.99 |
object_forced_source_nonprimary |
1285731 |
15180 |
5.35 |
0.99 |
source_nonprimary |
267902 |
14959 |
5.36 |
0.99 |
object_forced_source |
1285731 |
14222 |
5.38 |
0.99 |
isolated_star |
93346 |
7658 |
5.39 |
1.00 |
compare_warp_artifact_mask |
7398852 |
6639 |
5.39 |
1.00 |
dia_object_forced_source |
1285731 |
5544 |
5.40 |
1.00 |
visit_image_background |
37270840 |
4293 |
5.40 |
1.00 |
deep_coadd_n_image |
7398852 |
4272 |
5.41 |
1.00 |
visit_summary |
188340 |
3978 |
5.41 |
1.00 |
dia_source |
13015 |
1458 |
5.41 |
1.00 |
deep_coadd_background |
7398852 |
362 |
5.41 |
1.00 |
dia_object |
13015 |
193 |
5.41 |
1.00 |
CPU Time by Task#
For DR1, the total cpu time estimate is ~8700 node days, assuming 120 cores per node.
Table 8: Predicted CPU time for each task
task |
# jobs |
CPU time (s) |
cumulative node days |
|---|---|---|---|
isr |
35596260 |
3.28e+09 |
316.45 |
calibrateImage |
35596260 |
5.63e+09 |
859.03 |
standardizeSingleVisitStar |
35596260 |
2.37e+07 |
861.31 |
consolidateVisitSummary |
188340 |
6.61e+06 |
861.95 |
consolidateSingleVisitStar |
188340 |
2.67e+06 |
862.21 |
makeInitialVisitDetectorTable |
16 |
1.17e+04 |
862.21 |
makeInitialVisitTable |
16 |
8.00e+03 |
862.21 |
associateIsolatedStar |
93346 |
2.39e+07 |
864.51 |
analyzeSingleVisitStarAssociation |
93346 |
2.01e+08 |
883.89 |
makeAnalysisSingleVisitStarAssoc… |
16 |
4.28e+01 |
883.89 |
makeAnalysisSingleVisitStarAssoc… |
16 |
7.94e+02 |
883.89 |
fgcmBuildFromIsolatedStar |
16 |
5.89e+05 |
883.95 |
gbdesHealpix3AstrometricFit |
352800 |
3.11e+10 |
3883.59 |
refitPsfModelDetector |
35596260 |
1.32e+09 |
4011.00 |
fgcmFitCycle |
16 |
1.39e+07 |
4012.34 |
consolidateRefitPsfModelDetector |
188340 |
1.52e+07 |
4013.81 |
fgcmOutputProducts |
16 |
9.92e+03 |
4013.81 |
updateVisitSummary |
188340 |
1.87e+08 |
4031.86 |
recalibrateSingleVisitStar |
35596260 |
3.01e+08 |
4060.86 |
makeVisitDetectorTable |
16 |
6.12e+04 |
4060.87 |
makeVisitTable |
16 |
5.35e+04 |
4060.87 |
standardizeRecalibratedStar |
35596260 |
9.81e+06 |
4061.82 |
consolidateRecalibratedStar |
188340 |
2.25e+06 |
4062.03 |
analyzeRecalibratedStarAssociation |
93346 |
1.68e+08 |
4078.21 |
makeAnalysisRecalibratedStarAsso… |
16 |
5.25e+01 |
4078.21 |
makeAnalysisRecalibratedStarAsso… |
16 |
8.83e+02 |
4078.21 |
makeDirectWarp |
107391908 |
3.87e+09 |
4451.69 |
selectDeepCoaddVisits |
7398852 |
1.30e+08 |
4464.26 |
selectTemplateCoaddVisits |
7398852 |
1.29e+08 |
4476.71 |
makePsfMatchedWarp |
107391908 |
3.96e+09 |
4858.37 |
assembleDeepCoadd |
7398852 |
2.66e+09 |
5114.67 |
assembleTemplateCoadd |
7398852 |
1.26e+09 |
5236.62 |
makeBinnedDeepNImage |
7398852 |
4.56e+05 |
5236.67 |
assembleCellCoadd |
7398852 |
1.58e+09 |
5389.08 |
makeHealSparsePropertyMaps |
74936 |
8.09e+07 |
5396.89 |
detectCoaddPeaks |
7398852 |
6.17e+08 |
5456.41 |
makeBinnedTemplateNImage |
7398852 |
4.42e+05 |
5456.45 |
makeWholeTractDeepNImage |
74936 |
1.22e+05 |
5456.47 |
plotPropertyMapTract |
74936 |
1.21e+07 |
5457.64 |
consolidateHealSparsePropertyMaps |
60 |
1.80e+05 |
5457.65 |
makeBinnedCoaddImage |
7398852 |
6.93e+06 |
5458.32 |
mergeObjectDetection |
1285731 |
3.31e+07 |
5461.52 |
makeWholeTractTemplateNImage |
74936 |
1.43e+05 |
5461.53 |
plotPropertyMapSurvey |
60 |
7.36e+04 |
5461.54 |
makeWholeTractImage |
74936 |
3.74e+05 |
5461.57 |
deconvolve |
7398852 |
1.65e+09 |
5621.07 |
deblendCoaddFootprints |
1285731 |
1.37e+09 |
5752.80 |
measureObjectUnforced |
7398852 |
3.23e+09 |
6064.14 |
fitDeepCoaddPsfGaussians |
7398852 |
1.37e+09 |
6196.36 |
mergeObjectMeasurement |
1285731 |
5.44e+06 |
6196.89 |
fitDeblendedObjectsExp |
1285731 |
9.61e+08 |
6289.60 |
measureObjectForced |
7398852 |
8.99e+09 |
7156.77 |
fitDeblendedObjectsSersic |
1285731 |
7.33e+08 |
7227.47 |
rewriteObject |
1285731 |
1.45e+07 |
7228.87 |
computeObjectEpochs |
1285731 |
1.85e+06 |
7229.05 |
standardizeObject |
1285731 |
2.19e+07 |
7231.16 |
consolidateObject |
13015 |
2.98e+06 |
7231.44 |
analyzeObjectTableCore |
13015 |
2.66e+06 |
7231.70 |
analyzeObjectTableSurveyCore |
10 |
7.34e+05 |
7231.77 |
catalogMatchTract |
13015 |
1.44e+05 |
7231.79 |
photometricCatalogMatch |
13015 |
1.46e+05 |
7231.80 |
validateObjectTableCore |
13015 |
8.27e+03 |
7231.80 |
splitPrimaryObject |
13015 |
3.92e+06 |
7232.18 |
makeMetricTableObjectTableCore |
10 |
3.53e+01 |
7232.18 |
refCatObjectTract |
13015 |
2.10e+05 |
7232.20 |
photometricRefCatObjectTract |
13015 |
2.04e+05 |
7232.22 |
objectTableCoreWholeSkyPlot |
10 |
1.53e+03 |
7232.22 |
makeMetricTableObjectTableCoreRe… |
10 |
2.10e+01 |
7232.22 |
objectTableCoreRefCatMatchWholeS… |
10 |
2.29e+02 |
7232.22 |
analyzeRecalibratedStarObjectMatch |
267902 |
1.22e+07 |
7233.40 |
reprocessVisitImage |
37270840 |
3.13e+09 |
7535.44 |
standardizeSource |
37270840 |
1.22e+07 |
7536.62 |
rewarpTemplate |
37270840 |
1.62e+09 |
7692.64 |
consolidateSource |
267902 |
4.26e+06 |
7693.05 |
subtractImages |
37270840 |
2.35e+09 |
7920.17 |
associateAnalysisSource |
13015 |
4.89e+06 |
7920.64 |
splitPrimarySource |
267902 |
1.99e+06 |
7920.83 |
detectAndMeasureDiaSource |
37270840 |
1.86e+09 |
8100.16 |
analyzeSourceAssociation |
13015 |
2.68e+07 |
8102.75 |
filterDiaSource |
37270840 |
1.90e+07 |
8104.58 |
forcedPhotObjectDetector |
61040677 |
5.03e+09 |
8589.74 |
makeAnalysisSourceAssociationMet… |
10 |
2.53e+01 |
8589.74 |
computeReliability |
37270840 |
1.73e+08 |
8606.45 |
standardizeObjectForcedSource |
1285731 |
1.48e+07 |
8607.88 |
makeAnalysisSourceAssociationWho… |
10 |
4.88e+02 |
8607.88 |
filterDiaSourcePostReliability |
37270840 |
2.45e+06 |
8608.11 |
splitPrimaryObjectForcedSource |
1285731 |
1.14e+06 |
8608.22 |
standardizeDiaSource |
37270840 |
4.02e+07 |
8612.10 |
consolidateVisitDiaSource |
267902 |
9.57e+05 |
8612.19 |
associateDiaSource |
1285731 |
1.80e+07 |
8613.92 |
calculateDiaObject |
1285731 |
1.12e+07 |
8615.00 |
consolidateDiaSource |
13015 |
4.36e+04 |
8615.01 |
consolidateSsTables |
10 |
6.00e+02 |
8615.01 |
consolidateDiaObject |
13015 |
1.22e+04 |
8615.01 |
forcedPhotDiaObjectDetector |
61040677 |
1.05e+09 |
8715.87 |
analyzeDiaSourceTableTract |
13015 |
1.66e+05 |
8715.89 |
standardizeDiaObjectForcedSource |
1285731 |
2.13e+07 |
8717.94 |
Data Selection#
The DR1 shown below yields the first 188340 visits from baseline_v5.0.0_10yrs.db.
select * from observations where
   observationStartMJD <= (select min(observationStartMJD) from observations) + 365.25